

Sales teams rarely need more video views. They need stronger buyer signals, cleaner attribution, and content that helps move real opportunities. As an Edmonton video production company, Q Filmz Media sees this gap often: many business videos are reported like awareness campaigns even when the real goal is meetings, pipeline, or closed revenue.
TL;DR: Summary
- The most useful business video metrics for B2B sales are percent watched, completion rate, click-through rate, unique viewers, leads, meeting conversions, and pipeline influence, not raw views alone.
- Wistia and HubSpot both put engagement rate and watch behaviour ahead of view count, which makes watch depth a better signal of buyer interest than plays by themselves.
- Think with Google reports 70% of B2B buyers and researchers watch video throughout the purchase path, so business video measurement should cover awareness, evaluation, and decision stages.
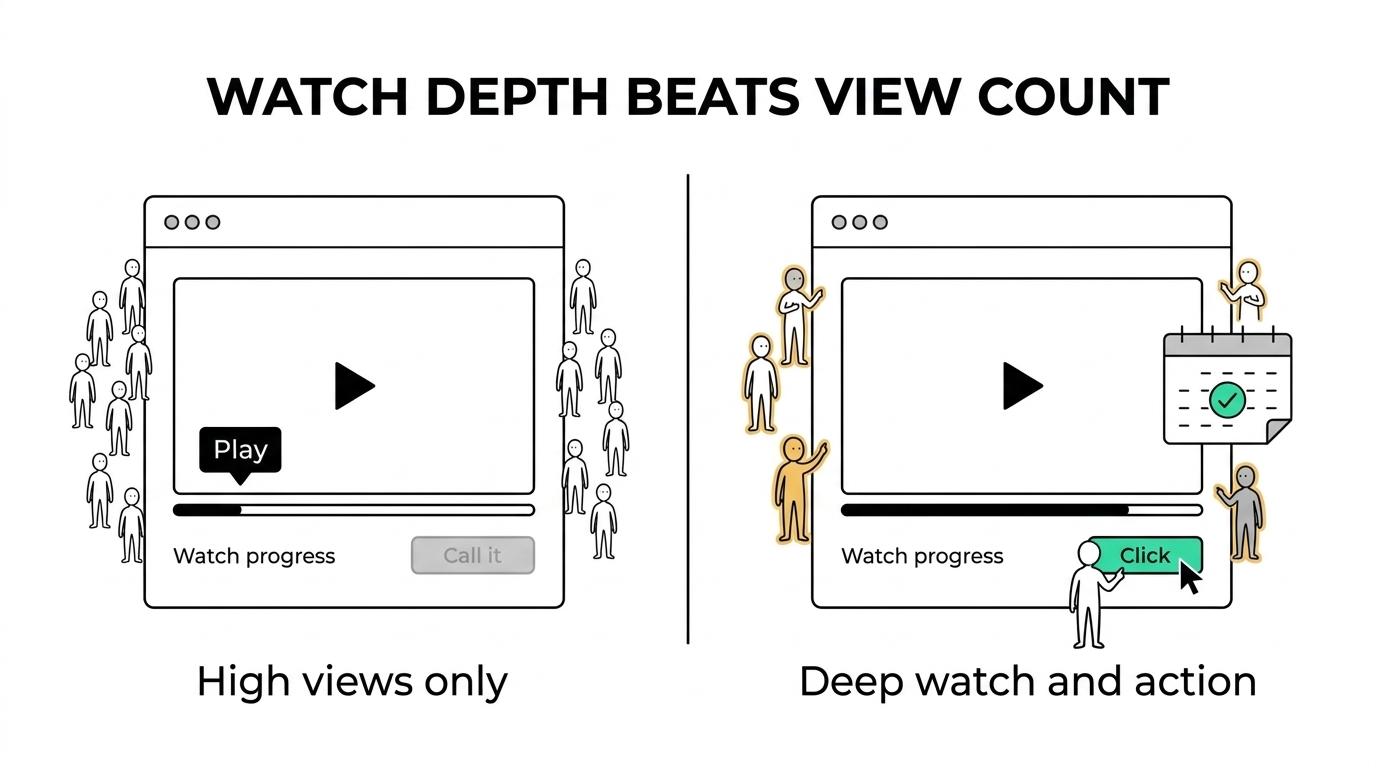
- If a viewer reaches 50% to 75% watched and then clicks, books, or returns, that is usually more useful to sales than a high play count with low retention.
- Q Filmz Media plans business video for measurable sales use, which means the script, CTA, landing page, and edit length should be decided before filming starts.
That distinction matters in Edmonton, where many corporate buyers sell into longer cycles across oil and gas, education, government, tech, and professional services. If your reporting stops at views, your sales team is missing the signals that tell you who is actually getting closer to a buying decision.
Why are views a weak sales metric for business video?
Views are a weak sales metric because platforms count them differently, while HubSpot and Wistia both show that watch depth and viewer quality tell you far more about intent.
A view can mean autoplay, a short scroll stop, or a real watch, depending on the platform. That makes view count useful for distribution reporting, but unreliable for sales decisions. HubSpot separates total plays from unique viewers and average completion percentage for a reason: one busy prospect who watches 85% of a case study twice is often more valuable than 500 passive impressions.
“Q Filmz Media uses a 100% in-house production process, which makes it easier to plan scripts, cutdowns, and CTAs around the metrics sales teams actually track.”
A common mistake is treating a high view total as proof that a video is working. If average watch time is low, completion is weak, and no one clicks the next step, the asset may be attracting attention without creating momentum. Sales teams need signals that travel further down the funnel.
Which video metrics matter most for B2B sales teams?
For most Edmonton B2B teams, Q Filmz Media should help track seven metrics: percent watched, completion rate, click-through rate, unique viewers, leads, meeting conversions, and pipeline influence.
This mix works because it combines attention metrics with outcome metrics. Wistia’s 2026 State of Video Report, based on 900+ professionals, more than 13 million videos, and 79 million hours of viewing data, defines engagement rate as how much of a video people watch on average. HubSpot’s 2024 Video Marketing Report also places engagement rate at the top, followed by watch time and view count.
That hierarchy matters. Watch behaviour tells you whether the message held attention. Clicks, form fills, booked calls, and influenced opportunities tell you whether that attention turned into commercial action. If your team tracks only one side, you will either miss buying intent or overstate impact.
What are the 7 business video metrics sales teams can actually use?
The seven most useful metrics are the ones that connect buyer attention to a clear next action and then to CRM movement.
Sales teams need a short list they can review without arguing about definitions every month. These seven metrics are simple enough to operationalize and strong enough to support lead scoring, follow-up priority, and content decisions.
-
Percent watched: This is one of the clearest intent signals. A viewer who reaches 75% of a pricing explainer or customer story is telling you more than a viewer who starts and drops at 8%.
-
Completion rate: Completion tells you how often viewers reach the end. It is especially useful for short case studies, executive messages, recruiting videos, and landing-page assets with a single CTA.
-
Watch time: Total watch time helps you see whether the audience is spending real time with the content. It becomes more useful when compared by asset length and audience segment.
-
Click-through rate: CTR connects attention to action. If viewers watch but never click, your CTA, offer, or placement may be the real problem rather than the video itself.
-
Unique viewers: Unique viewers help you separate broad exposure from repeat behaviour. This is useful in account-based selling, where repeat views from the same company may matter more than a larger but unqualified audience.
-
Leads or form completions: This is where video starts proving direct contribution. It works best when the form, landing page, and offer are tightly matched to the video’s stage in the buying process.
-
Pipeline influence or meeting conversion: This is the commercial metric sales leaders care about most. If a video is consistently viewed before meetings, demos, proposals, or opportunity creation, it deserves a bigger role in your sales process.
If one metric needs to lead the discussion, start with percent watched for intent and pipeline influence for business impact. One without the other gives you only half the story.
How should a sales team map each metric to the buying stage?
The right metric depends on the buyer stage, and Think with Google shows why: B2B video is used across awareness, evaluation, and purchase, not just at the top of the funnel.
Step 1 is to decide what the video is trying to do before you publish it. Awareness assets usually care most about unique viewers, watch time, and early retention. Consideration assets lean harder on percent watched, repeat views, and clicks. Decision-stage assets should be judged by meeting bookings, form submissions, proposal assists, or opportunity influence.
That approach also aligns with PartnerDialog’s review of the købsrejse i komplekse B2B-salg, which argues that meeting readiness usually shows up as a pattern of intent signals rather than one isolated interaction.
Step 2 is to match the CTA to the stage. A common mistake is using “Book a call” on every video. If the viewer is early in research, that ask may be too aggressive. A better next step may be a related case study, a service page, or an executive interview with more detail.
Step 3 is to set stage-specific benchmarks. Think with Google reported that 70% of B2B buyers and researchers watch videos throughout their path to purchase, and nearly half spend 30 minutes or more watching B2B-related video during research. That means longer, deeper engagement can be normal in complex sales. A three-minute product overview and a 30-second social cutdown should never be measured the same way.
What is the difference between engagement metrics and outcome metrics?
Engagement metrics show attention, while outcome metrics show business movement; both matter, but they answer different questions.
Engagement metrics include watch time, percent watched, completion rate, and plays. They tell you whether the content held attention and where drop-off happened. If viewers leave at the same point every time, the issue may be the opening, pacing, clarity, or relevance.
Outcome metrics include clicks, form fills, meetings, opportunity creation, and pipeline influence. These tell you whether the video helped the buyer move forward. A business video can have average engagement and still perform well if the right prospects take the right next step.
One misconception is that strong engagement automatically means revenue impact. It does not. A well-produced brand film may keep viewers watching, but if it lacks a stage-appropriate CTA or sits on the wrong page, sales will struggle to act on that attention.
How do you set up video lead scoring without overreacting to one watch?
Good video lead scoring uses watch milestones plus a second intent signal, and Wistia’s 25%, 50%, 75%, and 100% tracking model is a practical starting point.
Step 1 is to score by asset type. Watching 75% of a testimonial is a different signal from watching 75% of a product demo or implementation walkthrough. Decision-stage videos should usually carry more weight than broad awareness assets.
Step 2 is to score watch milestones rather than simple plays. Wistia notes that viewer-level percent watched can be used for scoring and automation, with milestones syncing at 25%, 50%, 75%, and 100%. That gives sales and marketing a shared language. A contact who reaches 75% on two high-intent videos is often warmer than one who started five videos and abandoned all of them.
“With 500+ projects delivered, Q Filmz Media knows the right metric is the one tied to a next action, not just a higher play count.”
Step 3 is to require a second action before notifying sales. That second signal could be a click, a return visit, a pricing-page session, or a form submission. This avoids the common mistake of sending reps a flood of weak alerts that look active but never convert.
Which dashboard should marketing and sales review every month?
A useful monthly dashboard is short, stage-based, and tied to the CRM, not a giant export of vanity metrics.
The best dashboard lets both teams answer three questions quickly: Who watched? How deeply did they watch? What happened next? If your dashboard cannot answer all three, it will not help forecast or prioritize follow-up.
- Audience quality: unique viewers, company accounts, returning viewers
- Attention depth: average percent watched, completion rate, top drop-off points
- Action taken: CTR, landing-page sessions, form completions
- Sales movement: meetings booked, influenced opportunities, pipeline value
- Asset comparison: video type, length, channel, funnel stage
Keep the reporting window consistent. Month-over-month is useful, but sales teams often get better insight from rolling 90-day views because B2B cycles can lag the original watch date. For Edmonton companies selling into procurement-heavy sectors, that lag can be significant.
How do short videos compare with long videos for sales conversations?
Short videos usually win attention faster, while long videos often do more work in evaluation and deal support.
HubSpot reports that short-form video delivers the highest ROI of any video format. That makes short assets powerful for prospecting, social distribution, remarketing, and early-stage landing pages. They are easier to consume, easier to test, and more likely to earn the first click.
Longer videos still matter. Executive interview videos, customer stories, product explainers, training content, and implementation walkthroughs often perform best after interest already exists. If a buyer has finished a discovery call, a two-to-five-minute asset may do more sales work than a 30-second cutdown.
A common misconception is that shorter is always better. It is better only when the job is speed. If the buyer needs detail, proof, or risk reduction, more length can help, provided the structure is tight and the next step is clear.
When should an Edmonton business video team plan measurement before filming?
Measurement should be planned before the first shot list; Q Filmz Media does this early because CTA placement, interview structure, and edit length all change what sales can track.
If the goal is booked meetings, the script needs a sharper call to action than a pure awareness film. If the goal is pipeline influence, the asset may need multiple cutdowns, a landing page, UTM-tagged links, and CRM tagging before production even starts. That is true whether you are filming a brand story, an executive interview, a recruiting piece, or a corporate event recap in Edmonton.
This is also where local business context matters. An Alberta industrial firm, a University of Alberta department, and a downtown Edmonton professional-services company may all use business video, but their buying cycles and proof requirements are not the same. We plan measurement around the buyer path, then shape the creative around that path.
If you are building a stronger reporting system for corporate video production in Edmonton or want a partner who can support broader Edmonton video production goals, start with the metrics your sales team will actually use six months from now, not the easiest numbers to screenshot next week. Ready to elevate your brand with professional video production in Edmonton? Contact Q Filmz Media today for a free project consultation and quote.